Piri Reis — Book of Seafaring (16th c.)
Maps from the Kitâb-ı Bahriye by Ottoman admiral and cartographer Piri Reis. This 17th/18th-century manuscript copy from the Walters Art Museum contains 240+ maps charting the Mediterranean, Aegean, Adriatic, Black, and Caspian seas. CC0 via PDR.
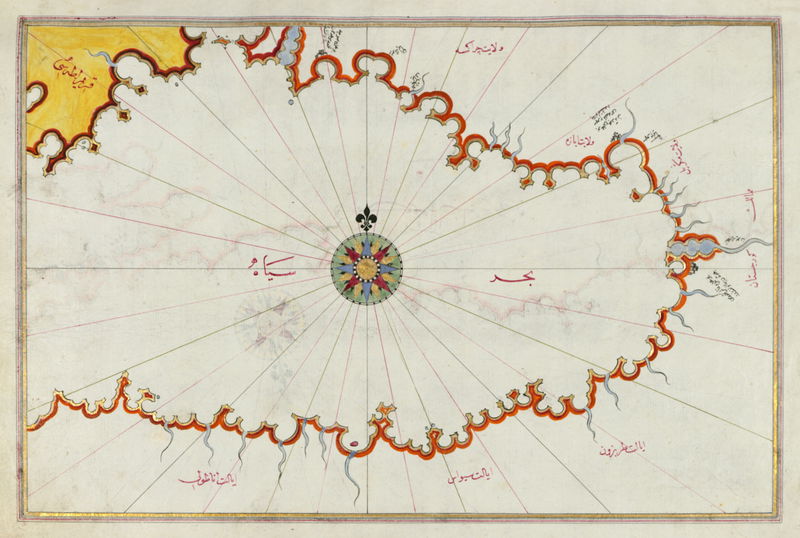
Piri Reis — Black Sea Coast
Coastlines have a looping, fractal quality that recall the edges of half-burnt leaves and pluming clouds of smoke. Mountains are illustrated as they might appear to a navigator at sea.
How to obtain
- Print yourself: High-res from Walters Art Museum (CC0). Also on PDR.
- Buy prints: Piri Reis prints available on Etsy (quality varies by seller).
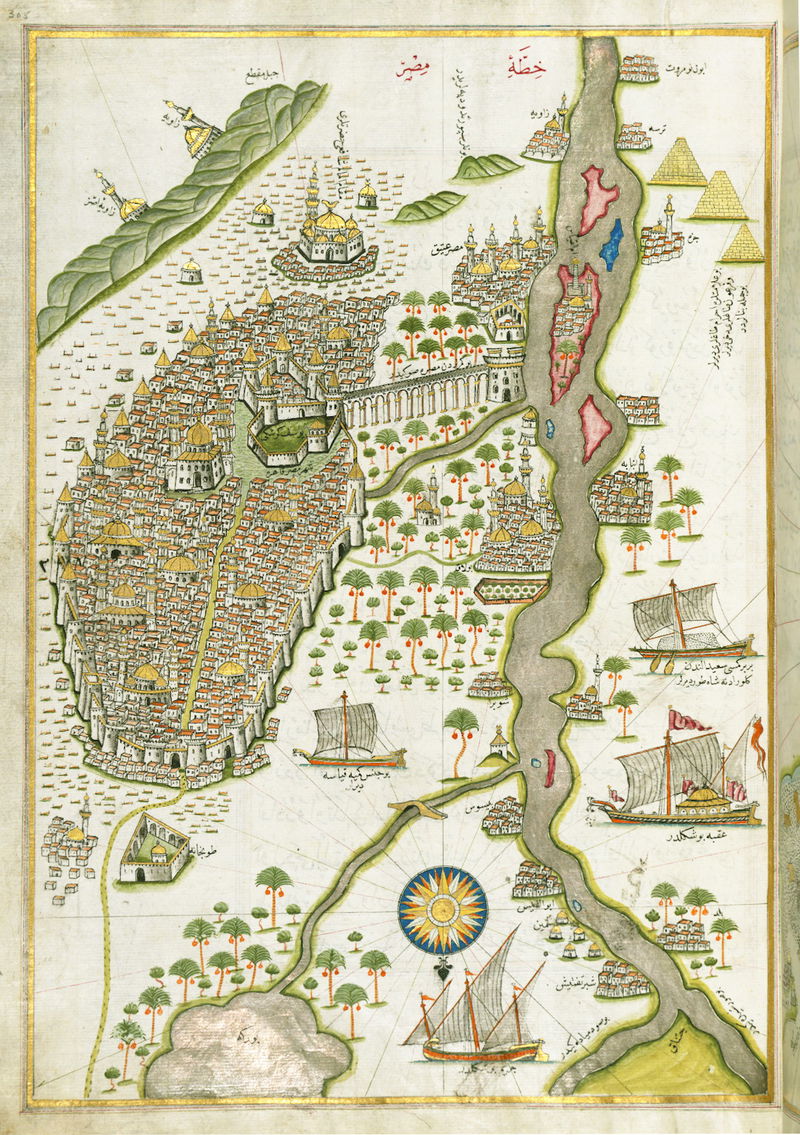
Piri Reis — City of Cairo
Piri Reis piloted a mission to Egypt with the grand vizier Ibrahim Pasha to reform the provincial administration. His intimate knowledge of Cairo is evident in this richly illustrated map from the Kitâb-ı Bahriye.
View collection at PDR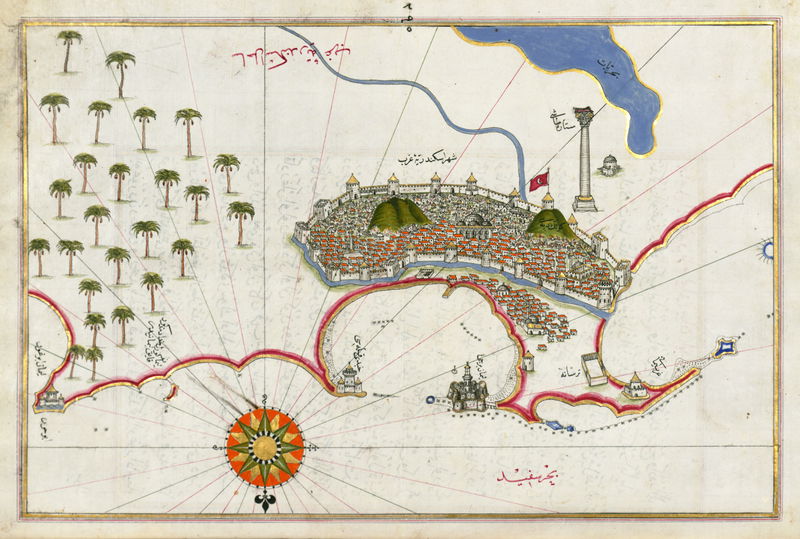
Piri Reis — City of Alexandria
Alexandria, one of the great cities of the ancient and medieval Mediterranean, rendered in Piri Reis' distinctive style with candy-colored mountains and looping coastlines. CC0 from the Walters Art Museum.
View collection at PDRPublic Domain Review — Fine Art Prints
Giclée archival prints on 100% cotton acid-free paper. From $40. Framed or unframed.
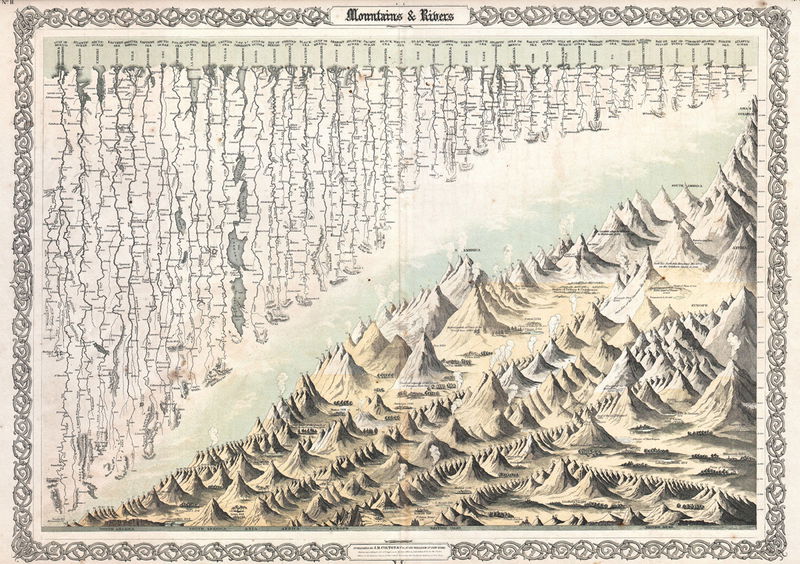
Mountains and Rivers
A comparison chart depicting the relative heights of great mountains and lengths of great rivers worldwide. Originally at the front of Colton's Atlas of the World.
How to obtain
- Buy from PDR: From $40. Sizes S/M/L. Frame options: black, white, natural, brown.
- Print yourself: High-res on Wikimedia Commons (public domain).
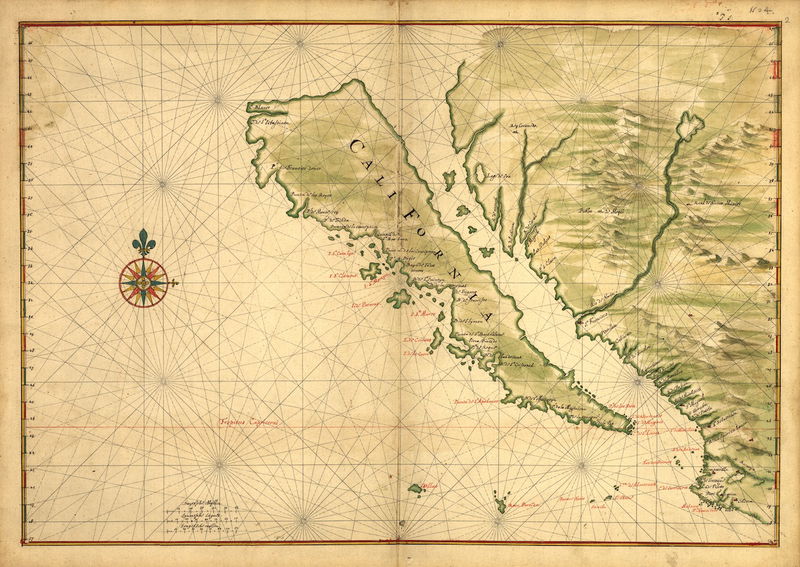
Map of California as an Island
A Dutch maritime map depicting one of cartography's most famous errors — California shown as an island. Features rhumb lines and a compass rose.
How to obtain
- Buy from PDR: From $40. Sizes S/M/L/XL. Frame options available.
- Print yourself: High-res on Wikimedia Commons (public domain).
Cerîde-i Adliye — Ottoman Justice Gazette Covers
Extraordinary data visualizations from the Turkish Ministry of Justice, 1920s. Fan charts, circular bar plots, pictorial tables. Among the last official uses of Arabic script before the 1928 alphabet reform. Source: David Rumsey Map Collection. High-res JP2 downloads available.
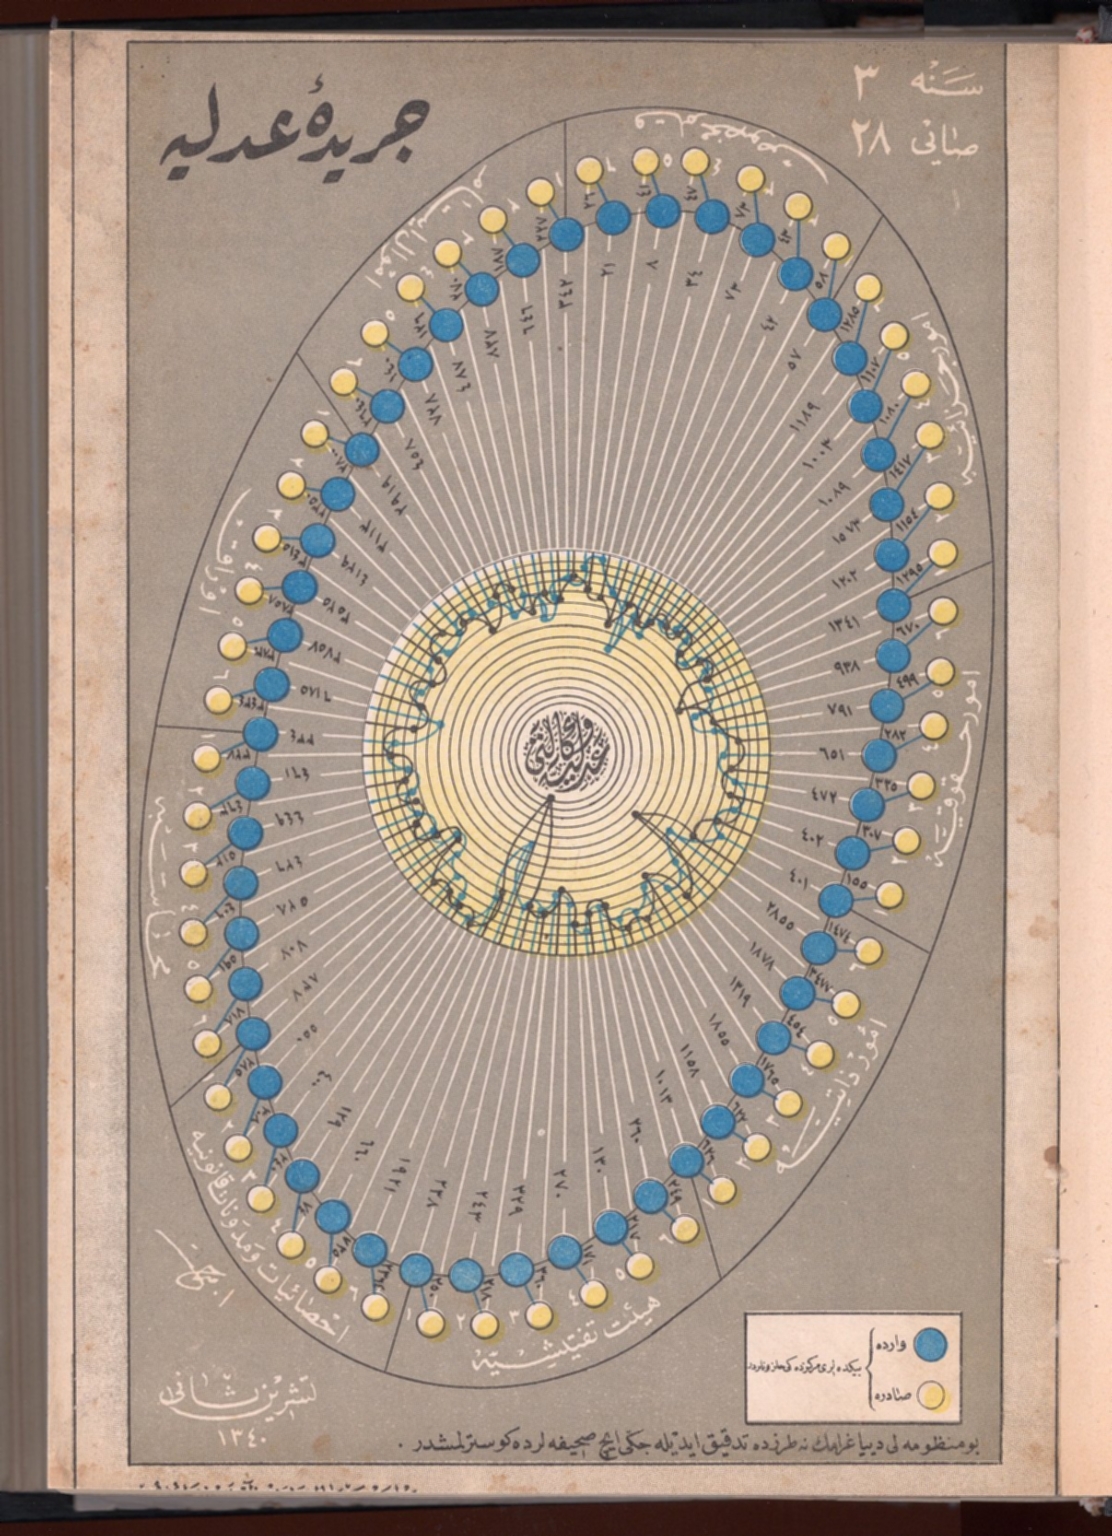
Cerîde-i Adliye — Cover 1
Cover from the Ottoman-era justice gazette featuring elaborate data visualizations of courthouse statistics — prisoner counts, homicide rates, court workloads — rendered in vivid fan charts and circular bar plots.
How to obtain
- Print yourself: Download high-res JP2 from David Rumsey. Print on heavyweight matte paper.
Cerîde-i Adliye — Cover 2
Another cover from the series. These designs blend Islamic arabesque influences with early 20th-century graphic abstraction, giving them an almost mystical quality.
Browse collection at David Rumsey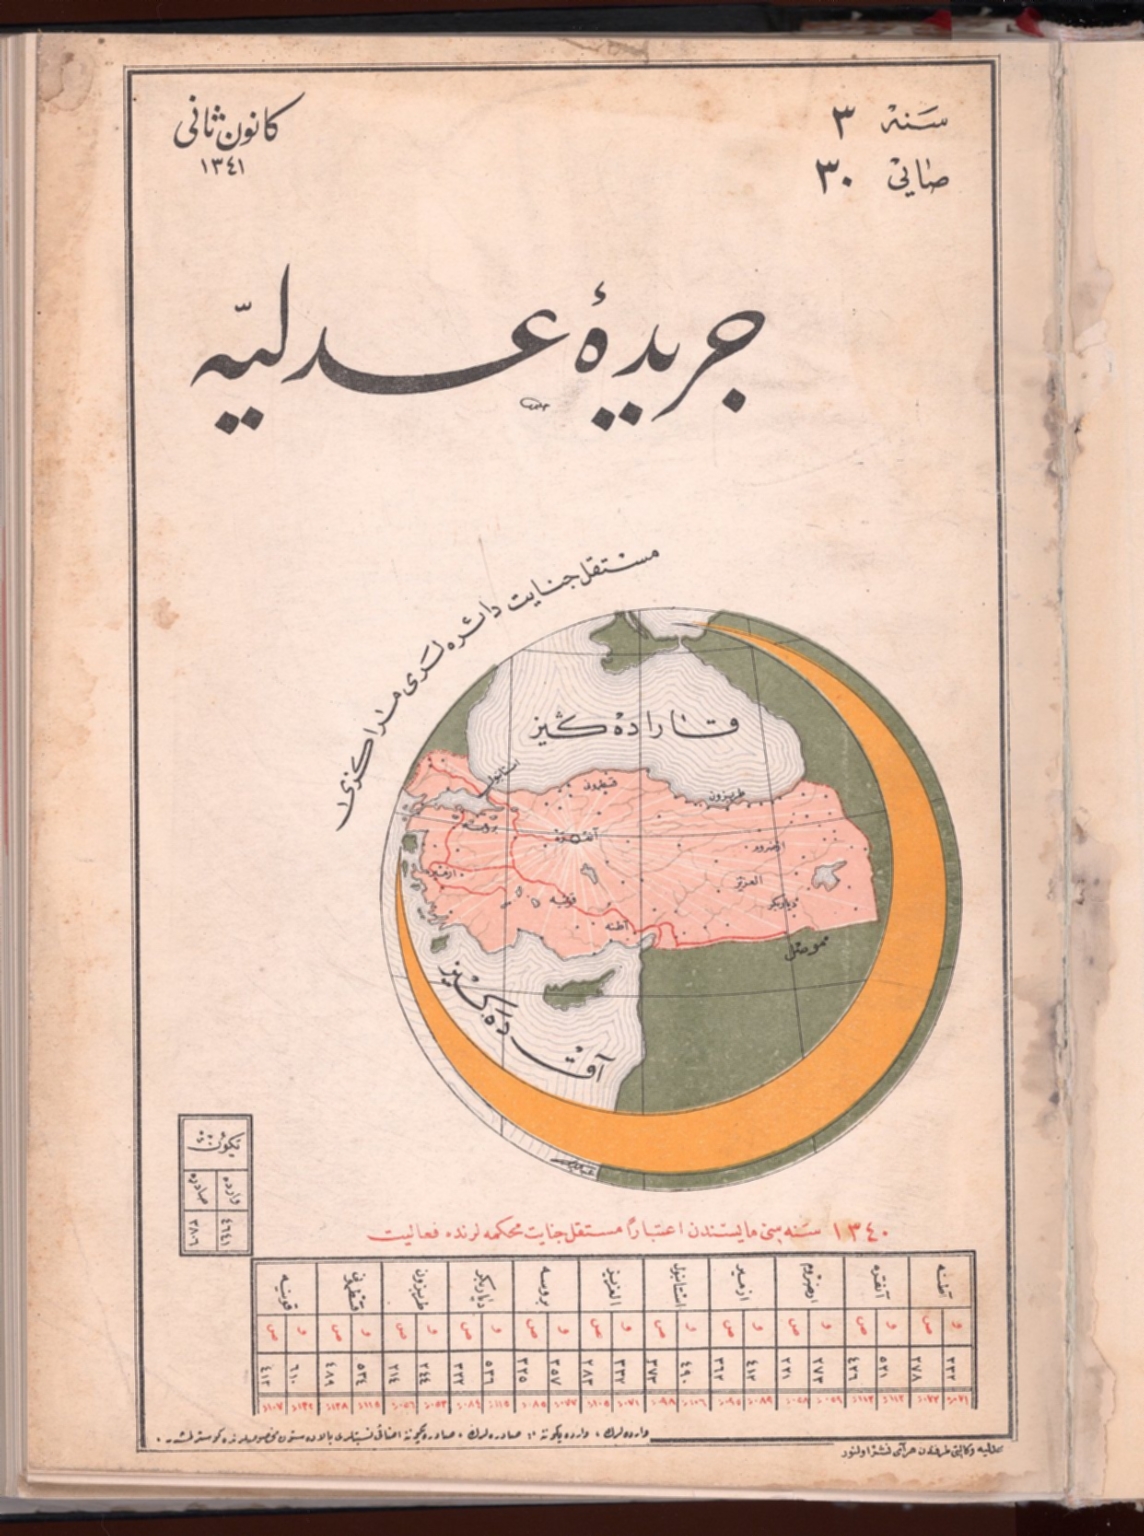
Cerîde-i Adliye — Cover 3
Features a central map surrounded by data tables and decorative crescent motifs. Published by Cumhuriyet Matbaası in Istanbul.
View at David Rumsey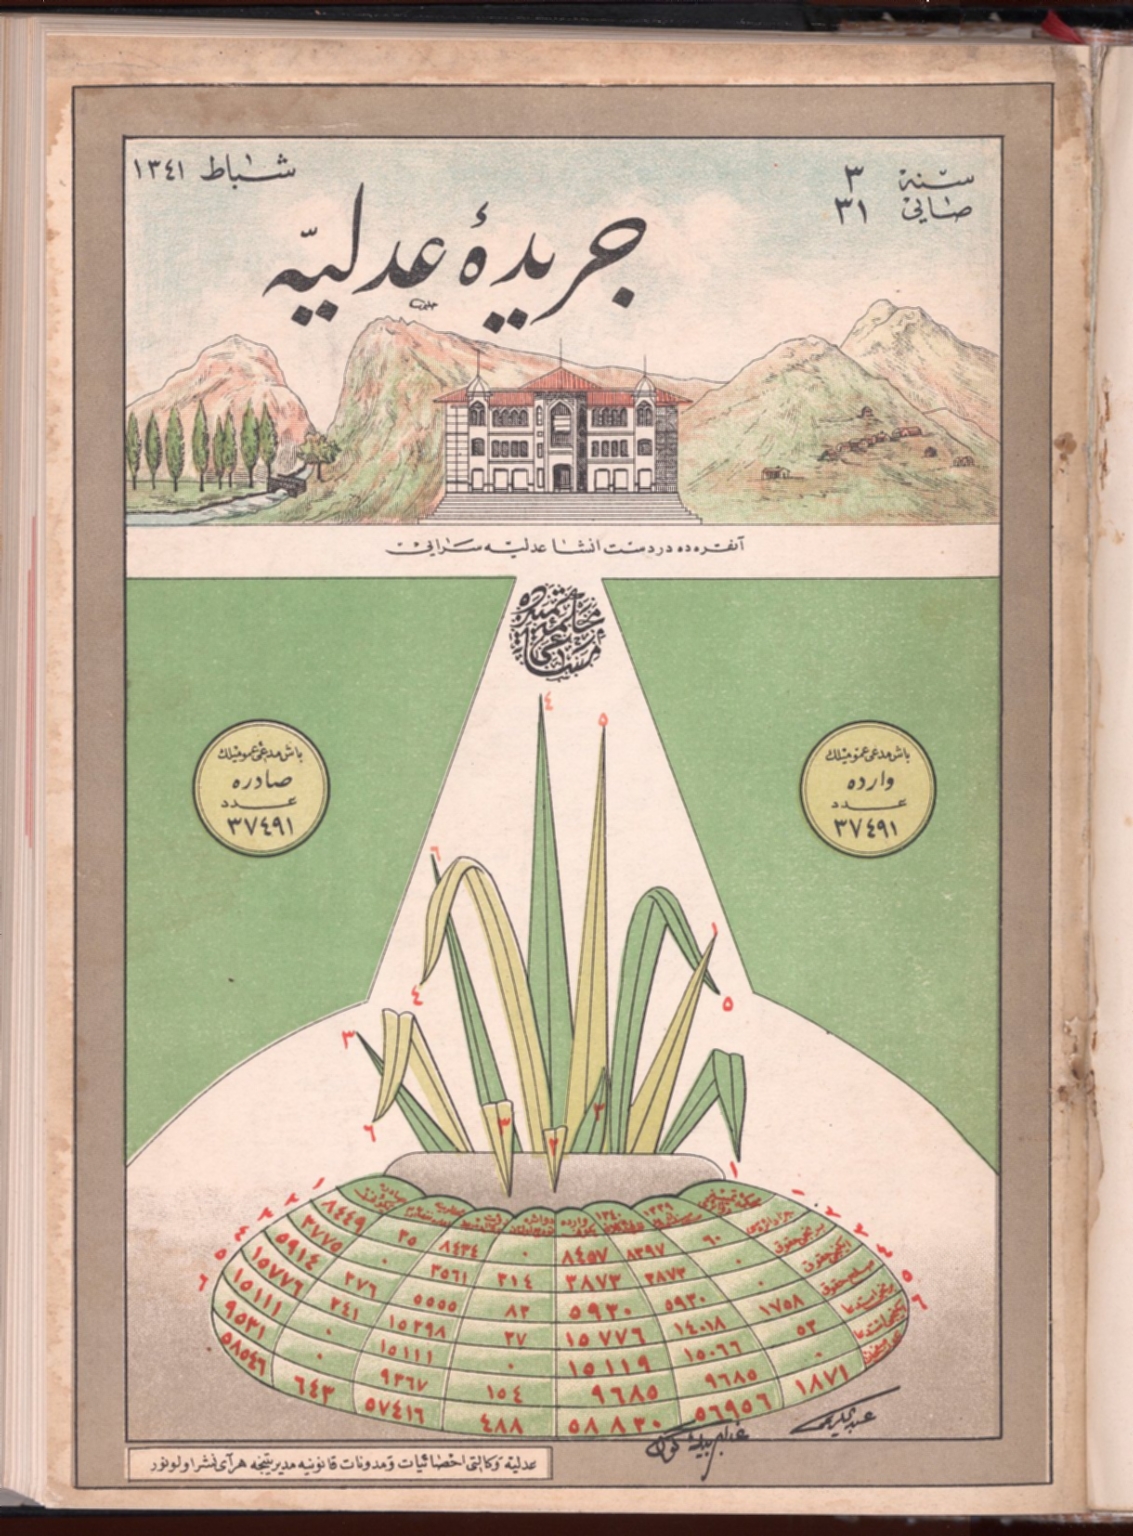
Cerîde-i Adliye — Cover 4
Innovative data visualizations including bar charts, fan charts, graphs, pictorial tables, roundels, and vignettes presenting judicial statistics.
Browse collection at David Rumsey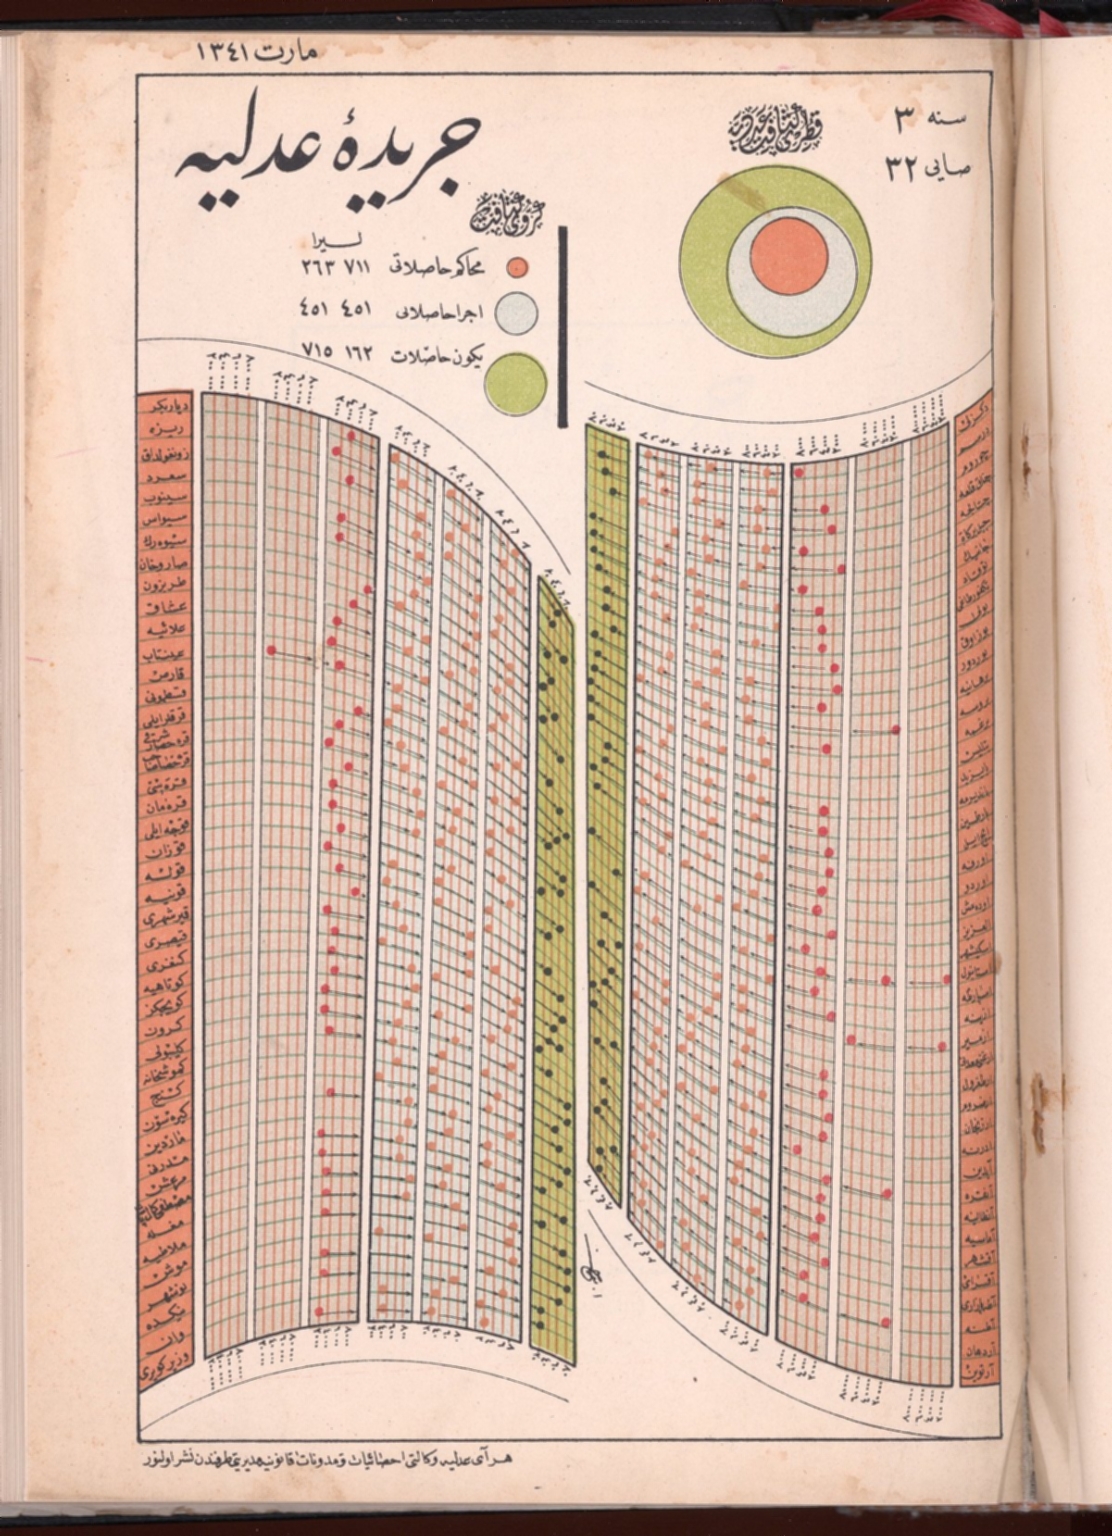
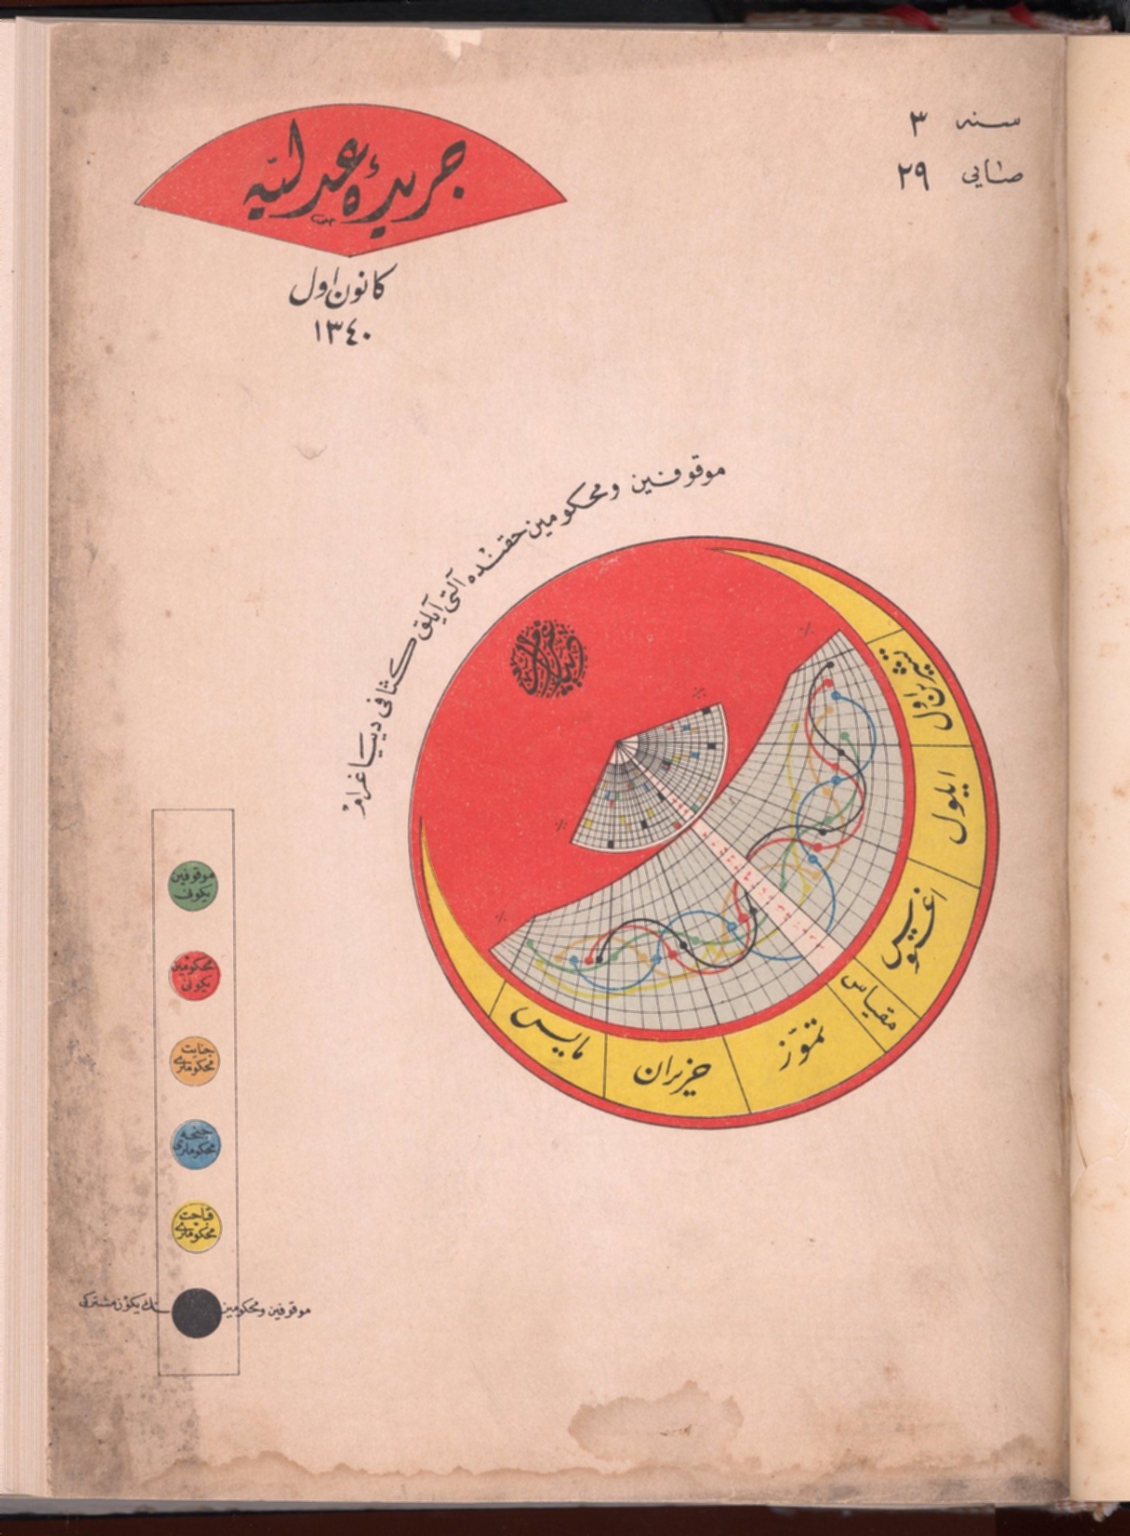
Cerîde-i Adliye — Cover 5
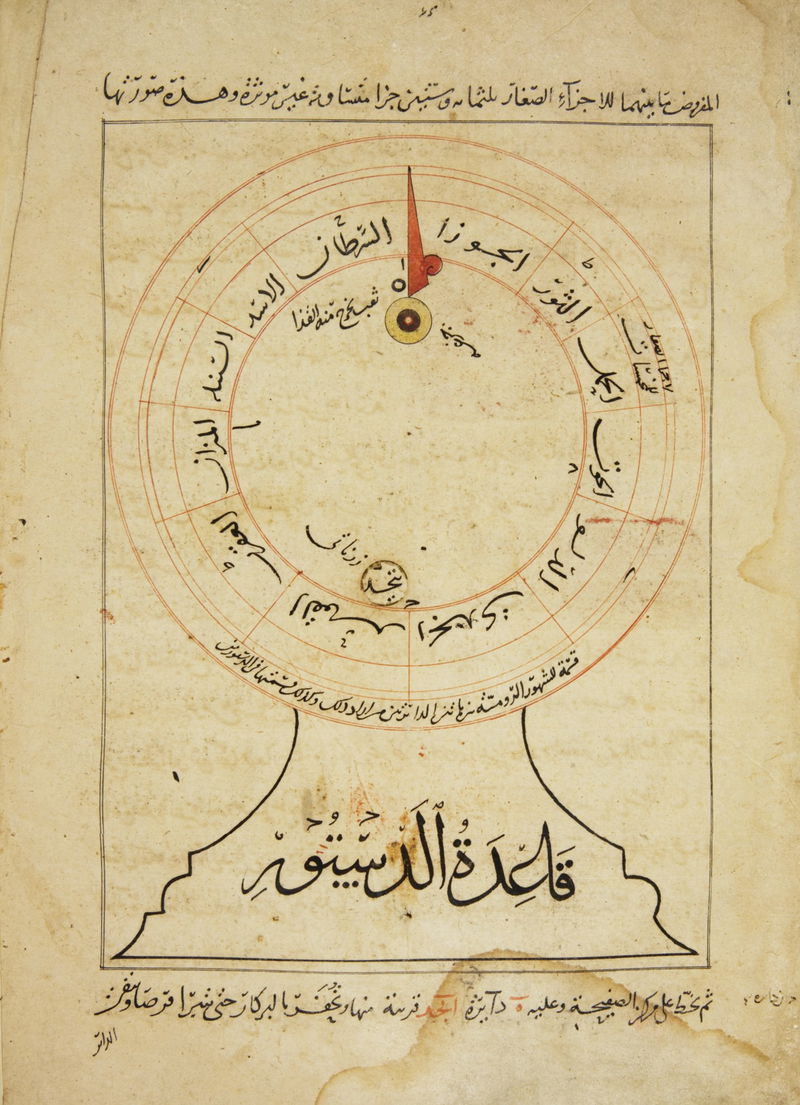
Some diagrams resemble sundials or celestial charts, lending them an almost architectural quality despite being judicial statistics.
Browse collection at David Rumsey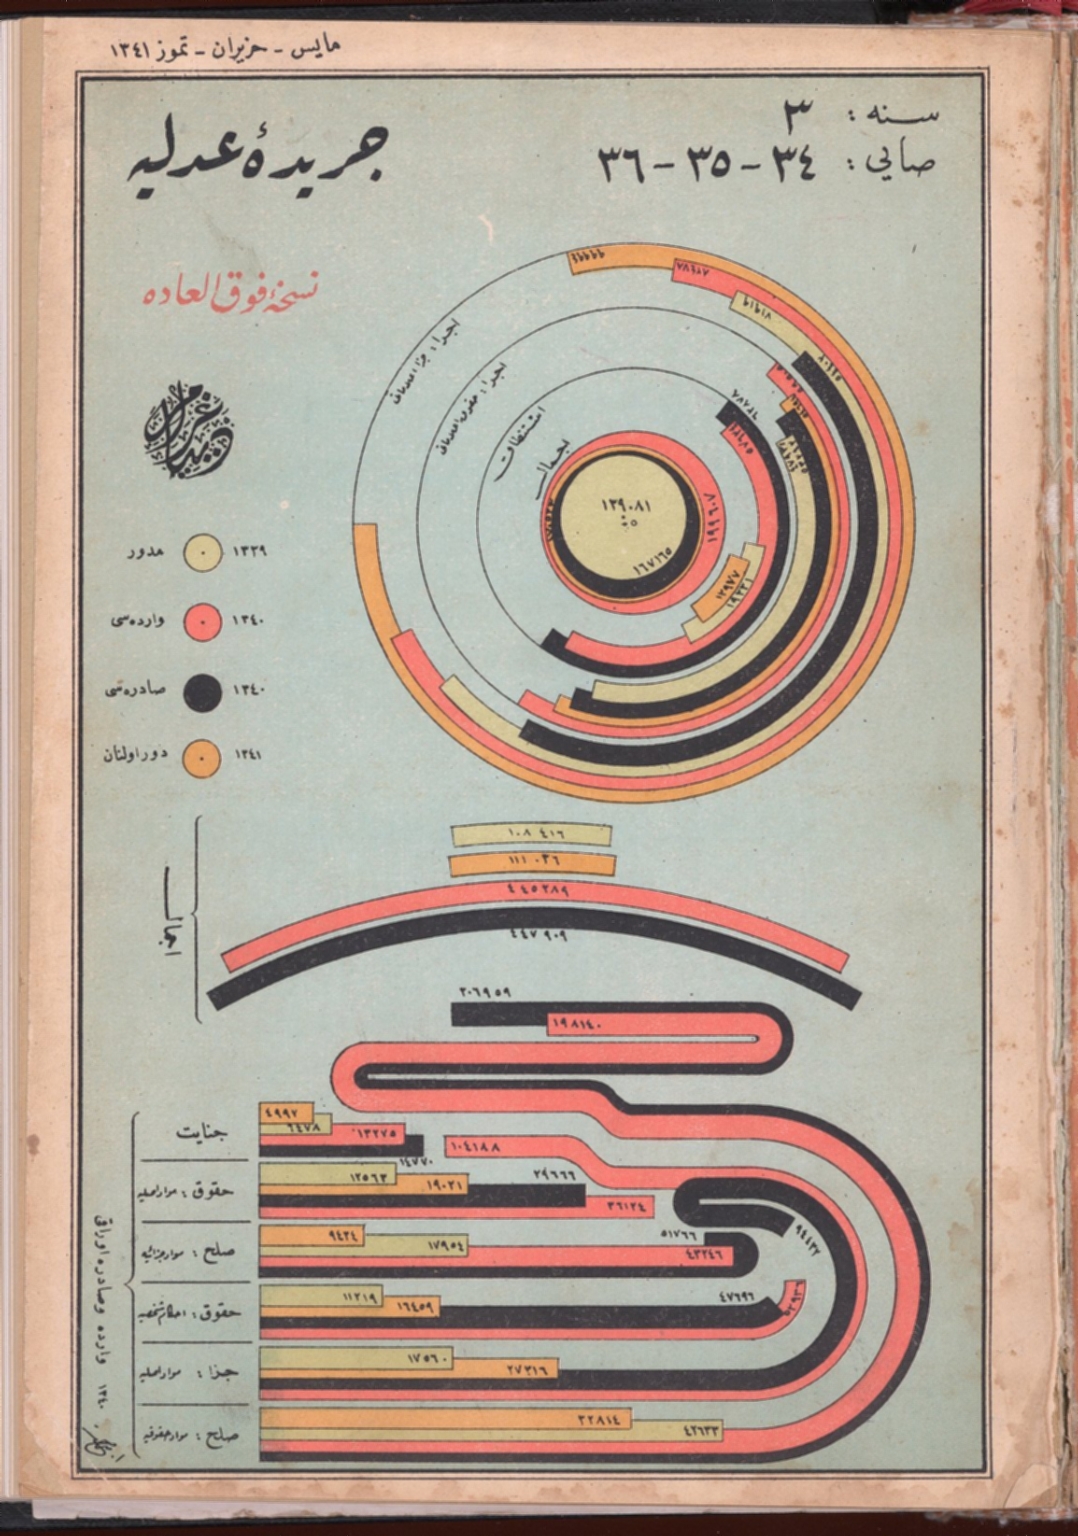
Cerîde-i Adliye — Cover 6
Energetic and bold designs with saturated colors and topsy-turvy Arabic type, reflecting the transition from Ottoman Empire to Turkish Republic.
Browse collection at David Rumsey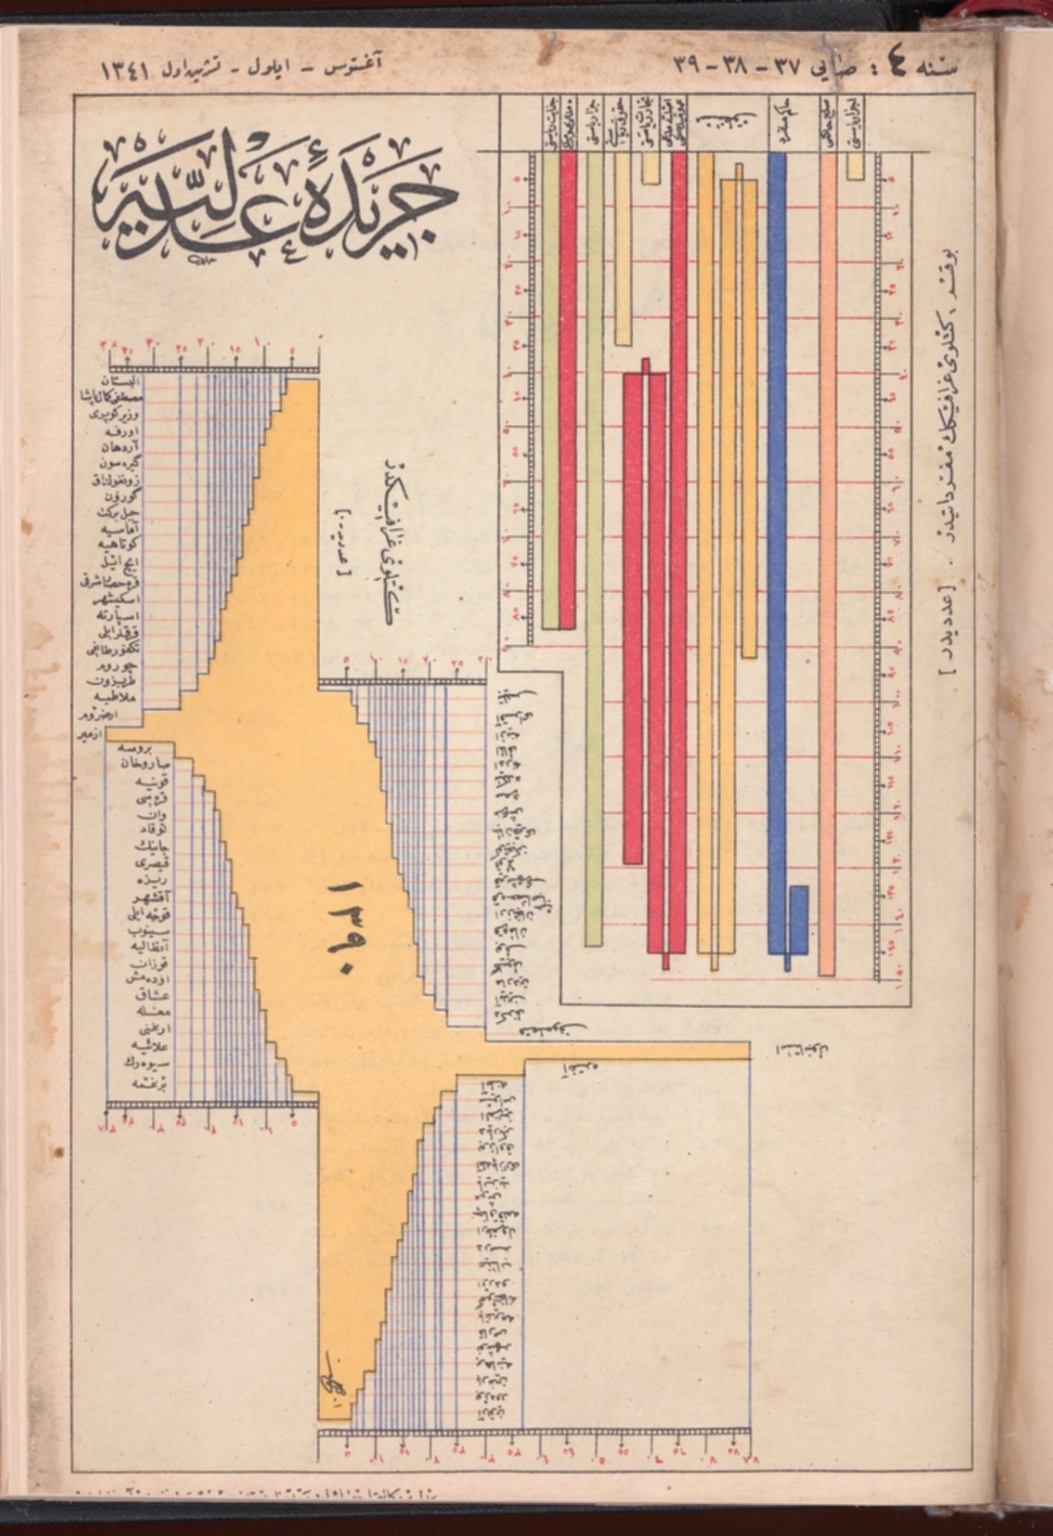
Cerîde-i Adliye — Cover 7
The full set of covers was originally sold by Peter Harrington (London) and is now preserved in the David Rumsey Historical Map Collection.
Further reading
- Casual Archivist: “Poetic Justice” — deep dive on these covers
- Deniz Cem Önduygu: “Measure of Justice” — design reinterpretation of the covers
W.E.B. Du Bois — Data Portraits (1900)
Hand-drawn infographics created for the 1900 Paris Exposition, visualizing African-American economic and social life. Bold, geometric, Mondrian-anticipating designs. Source: Library of Congress. Public domain.
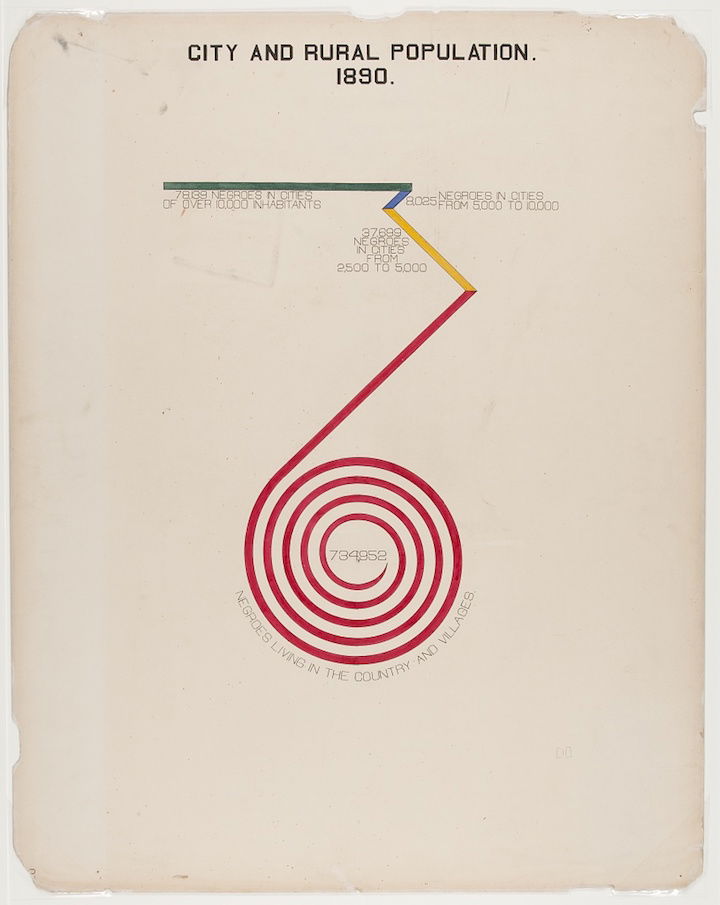
Du Bois — Spiral Chart
One of 58 hand-drawn charts created by Du Bois and his students at Atlanta University for the Paris Exposition. Strikingly vibrant and modern, almost anticipating Mondrian or Kandinsky.
How to obtain
- Print yourself: Free high-res from Library of Congress (public domain).
- Book: W.E.B. Du Bois's Data Portraits: Visualizing Black America — available at SFMOMA & Cooper Hewitt.
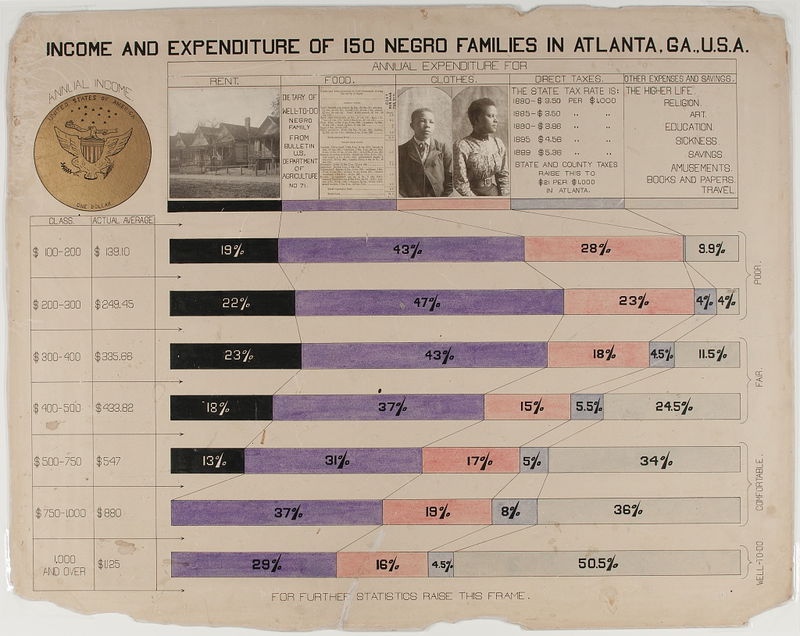
Du Bois — Georgia Negro
Many charts focus on economic life in Georgia, condensing enormous amounts of data into aesthetically daring, easily digestible visualizations.
Browse at Library of Congress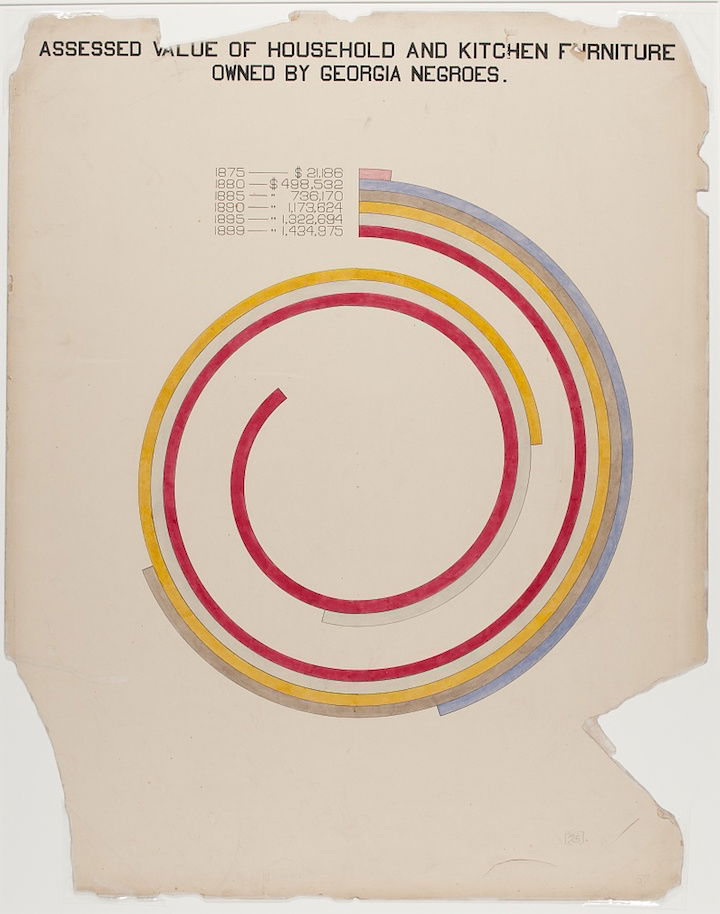
Du Bois — Occupations
Part of “The Exhibit of American Negroes” at the Paris Exposition Universelle, which occupied one-fourth of the total US exhibition space and was seen by an estimated 50 million visitors.
Browse at Library of CongressAl-Jazarī — Ingenious Mechanical Devices (13th c.)
Technical illustrations from the Book of Knowledge of Ingenious Mechanical Devices (1206) by Ismail al-Jazarī, chief engineer for the Artuqid court in Diyarbakir. This copy from a 17th-century manuscript at Berlin's Staatsbibliothek. CC BY-SA via PDR.
Al-Jazarī — Mechanical Device I
Red and yellow predominate, offset by indigo blue water. Gears and levers are rich in tone, while humanoid figures are simple, colorless sketches — machines come to the foreground, humans are incidental.
How to obtain
- Print yourself: Images from PDR collection (CC BY-SA). Right-click to save high-res.
- Buy a print: Isabella Stewart Gardner Museum sells archival prints from a 1354 copy.

Al-Jazarī — Mechanical Device II
Al-Jazarī described 50 devices: lock-like water-raising mechanisms, zodiac clocks, avian automata, and even a programmable robotic butler for hand-washing. He has been called “the father of robotics.”
View collection at PDR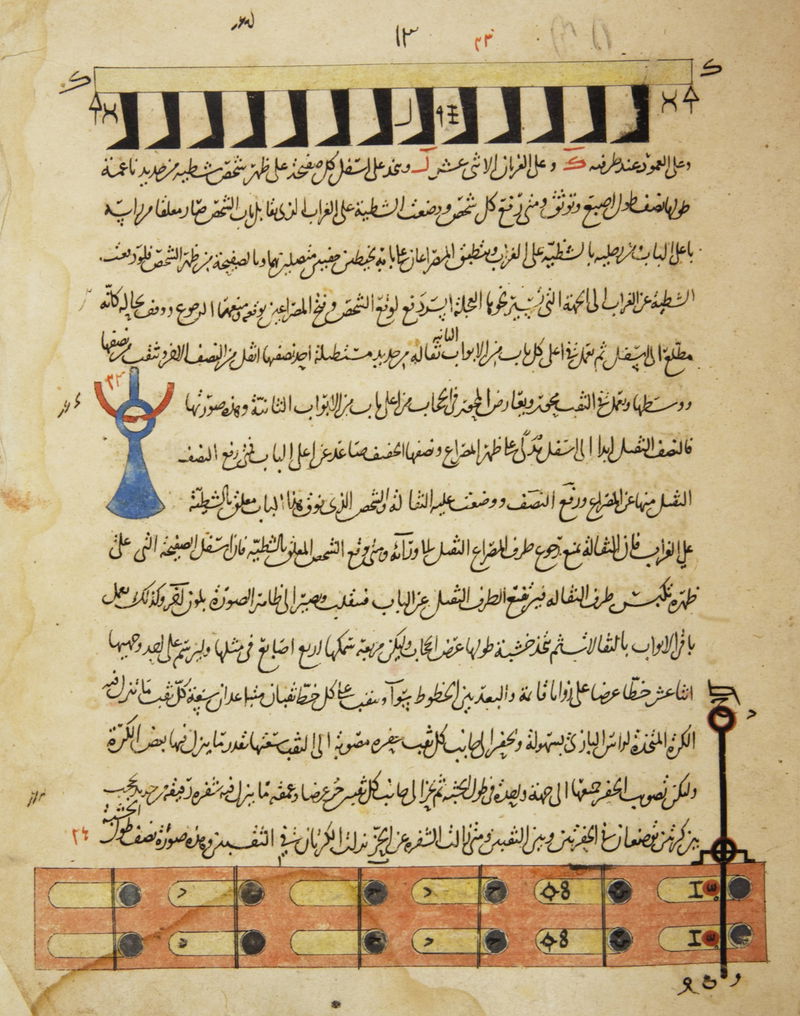
Al-Jazarī — Mechanical Device III
The Berlin manuscript illustrations focus on technical details and inner workings rather than aesthetic exteriors. Al-Jazarī stood on the shoulders of Persian, Greek, Indian, and Chinese precursors; Renaissance inventors, in turn, stood on his.
View collection at PDRMore prints to be added…